
imaginima
imaginima
Texas-based energy explorer Marathon Oil Corporation (NYSE:MRO) released its second-quarter 2022 results on August 3, 2022.
Note: This article is an update of my article published on February 24, 2022. I have followed MRO on Seeking Alpha since Dec. 2020.
The company owns a multi-basin portfolio. However, MRO is also producing oil from Equatorial Guinea, West Africa.
MRO owns a 63% operated working interest under a production sharing contract in the Alba field and an 80% operated working interest in Block D. Also, MRO owns a 52% interest in Alba Plant LLC, accounted for as an equity method investment, which uses an onshore LPG processing plant located on Bioko Island.

MRO Assets location from August Presentation (Marathon Oil)
MRO Assets location from August Presentation (Marathon Oil)
The company reported a second-quarter 2022 adjusted net income per share of $1.32, which easily beat analysts’ expectations compared to $0.22 per share a year ago.
Marathon Oil’s results were inflated by more robust liquid realizations and better-than-expected domestic production of 283K Boep/d. Marathon Oil reported revenues of $2,303 million, well above the year-ago revenues of $1,143 million, beating expectations.
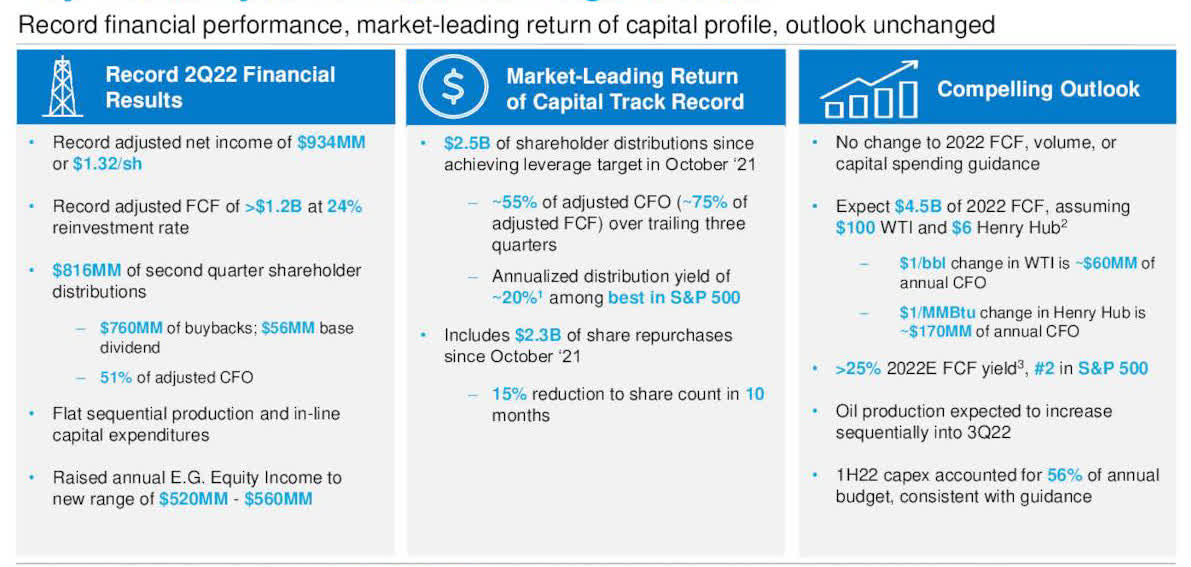
MRO 2Q22 Highlights (MRO Presentation)
MRO 2Q22 Highlights (MRO Presentation)
The company uses its excess cash to reward shareholders with dividends and buybacks. MRO has repurchased $2.3 billion of shares since October 2021 and increased dividends five times in the past six quarters to now $0.08 per share or a yield of 1.2%, which is still modest compared to the industry average.
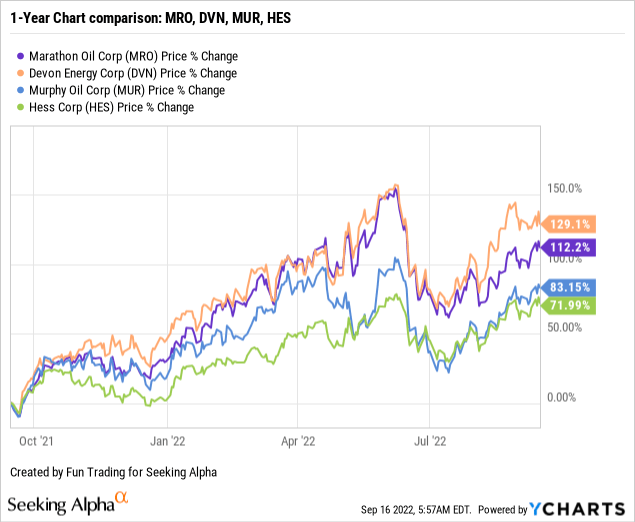
A quick one-year comparison with a few E&P (primarily domestic) shows that Devon Energy (DVN), MRO, and Murphy Oil (MUR) have significantly outperformed the group, with an increase of 112% on a one-year basis for MRO.
Marathon Oil is an attractive E&P company and a significant U.S. E&P producer. The fundamental analysis that I offer in my article justifies holding a long-term position in MRO. The primary source of revenue comes from the USA and protects shareholders from significant risks attached to geopolitical turmoil.
Furthermore, even though oil and gas prices have decreased recently due to a growing risk of recession triggered by rampant inflation, I believe the sector will be solid for the next few years.
On the negative side, MRO is paying a low dividend, barely above 1%, which could discourage long-term investors from investing in this company. Furthermore, the risk attached to the international segment (Equatorial Guinea, West Africa) is non-negligible and represents 21.2% of the company’s total output.
Finally, despite a bullish environment, we can’t evade the oil market’s high volatility and cyclicity. Oil is subject to unpredictable and recurring swings that cannot be ignored. High oil prices have contributed to record inflation which may well push the world economy into a severe recession with demand destruction.
Thus, I recommend trading LIFO about 35-40% of your position to take advantage of those fluctuations while keeping a core long-term position.
CEO Lee Tillman said in the conference call:
While both equity and commodity markets remain characterized by significant day-to-day volatility, a few underlying trends remain well entrenched. Global demand for oil and gas continues to recover from the depths of the pandemic, while supply of oil and gas remains constrained by multiple years of underinvestment, strained supply chain, labor shortages and inconsistent, if not outright hostile regulatory policy on a global scale.
Sources: Marathon oil release
MRO Quarterly Revenues history (Fun Trading)
MRO Quarterly Revenues history (Fun Trading)
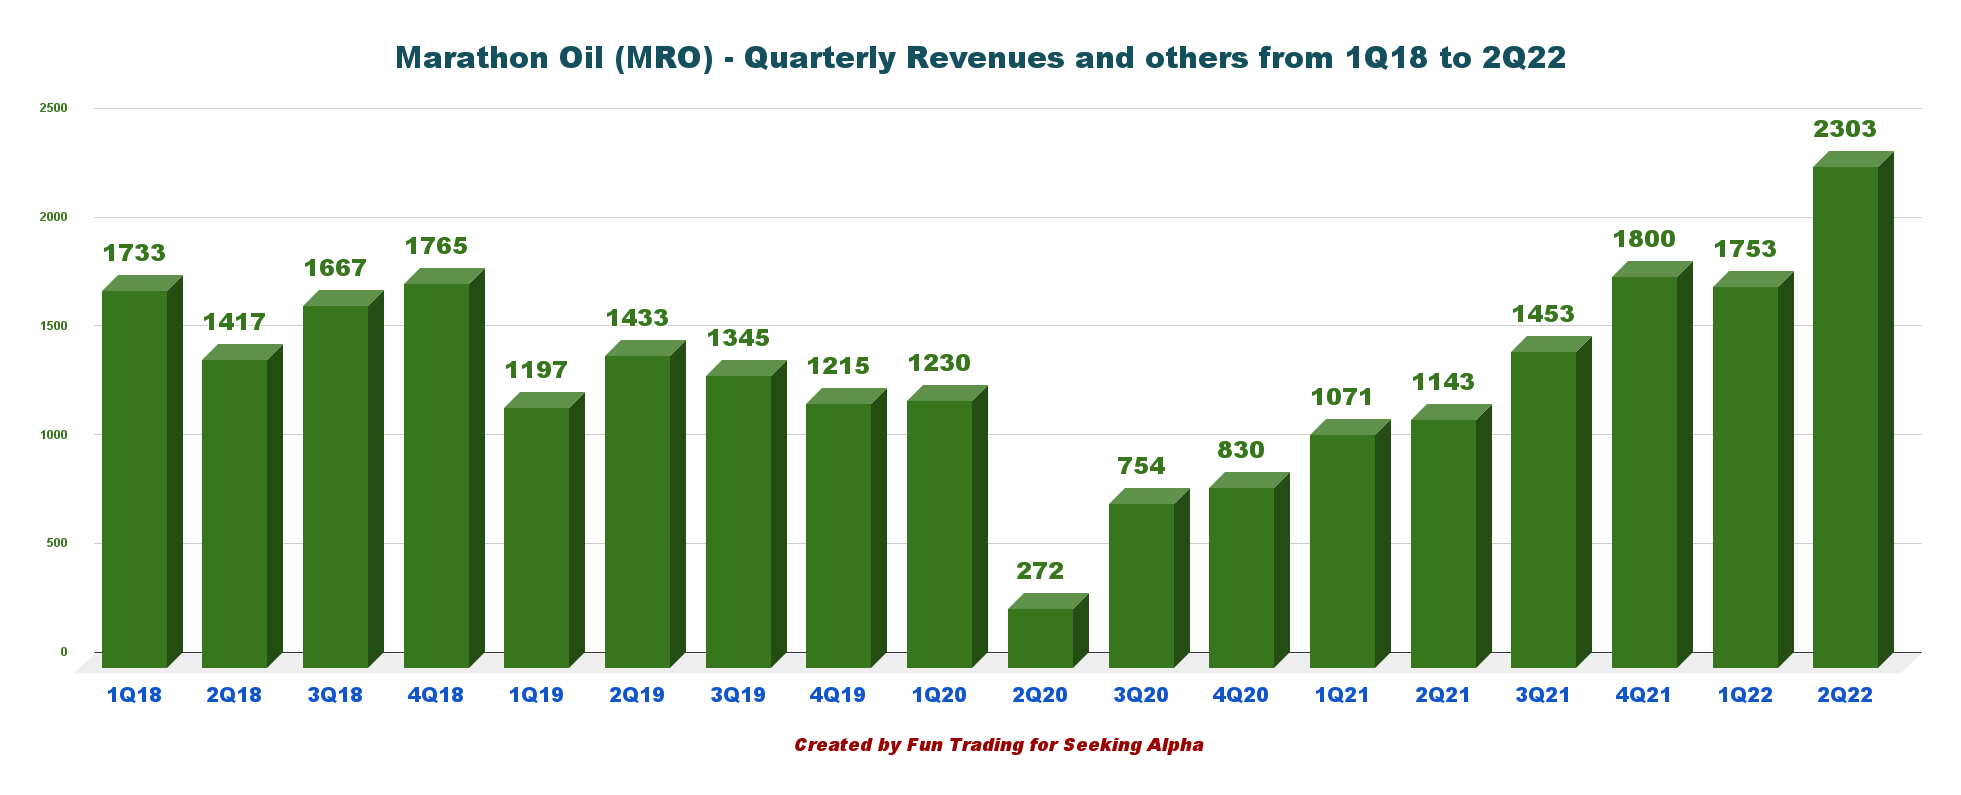
The second quarter’s revenues were $2,303 million, up significantly from the same quarter a year ago and up 31.4% sequentially.
Total costs in 2Q22 were $1,009 million, $29 million lower than the prior-year period. Marathon Oil reported an adjusted CFO of $1,586 million for the second quarter, up significantly from $701 million a year ago.
MRO Quarterly Free cash flow history (Fun Trading)
MRO Quarterly Free cash flow history (Fun Trading)
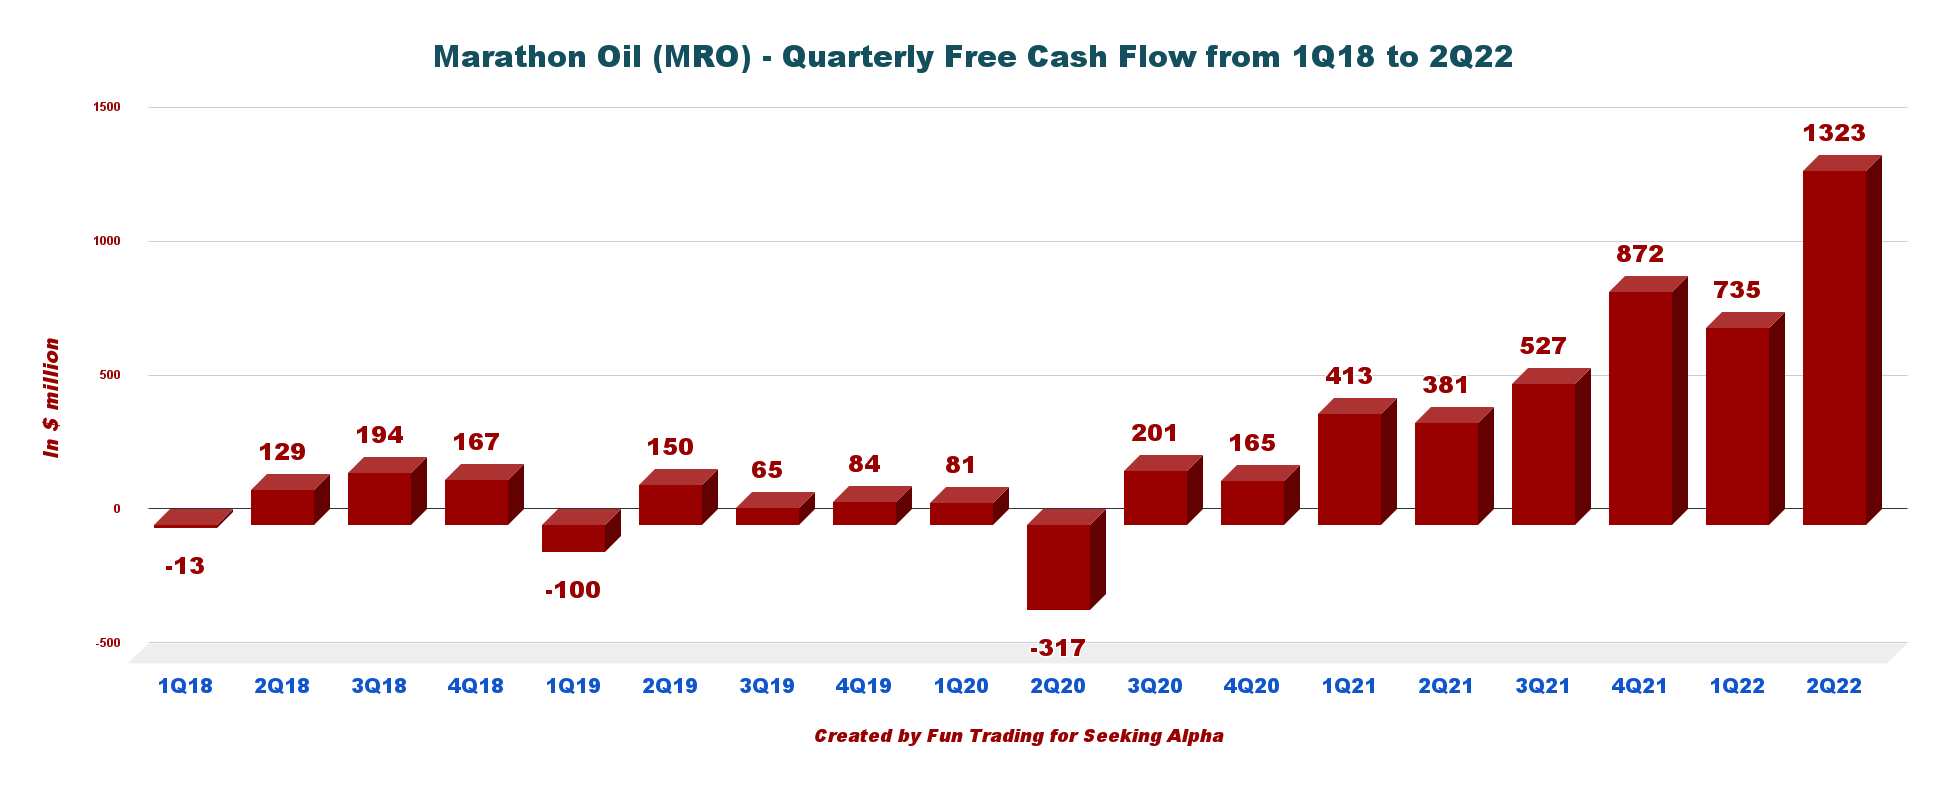
Note: The generic free cash flow is cash from operating activities minus CapEx. However, using a different calculation, the company indicated $1,213 million of adjusted free cash flow in 2Q22.
Trailing twelve-month free cash flow was $3,457 million, with a record 2Q22 free cash flow of $1,323 million.
This quarter, the quarterly dividend has been kept at $0.08 per share, which means a yearly cash expense of $226 million, easily covered by free cash flow.
In addition, the company executed $760 million of share repurchases this quarter, reducing the diluted share count by 3.7%.
However, after looking at the low dividend payment, I am not sure the company should continue buying back its stock which could be regarded as inflated. I prefer MRO to double the dividend payment and reduce the share buyback significantly. Thus, I’m afraid I have to disagree with what CEO Lee Tillman said in the conference call:
We have conviction we are pursuing the right strategy for our shareholders and stakeholders alike. It’s best summarized by our framework for success on Slide 4 of our deck. Strong corporate returns, sustainable free cash flow generation and meaningful return of capital to our shareholders through the commodity price cycle, all underpinned by a high-quality portfolio of U.S. unconventional resources complemented by global LNG exposure via our EG Integrated Gas business.
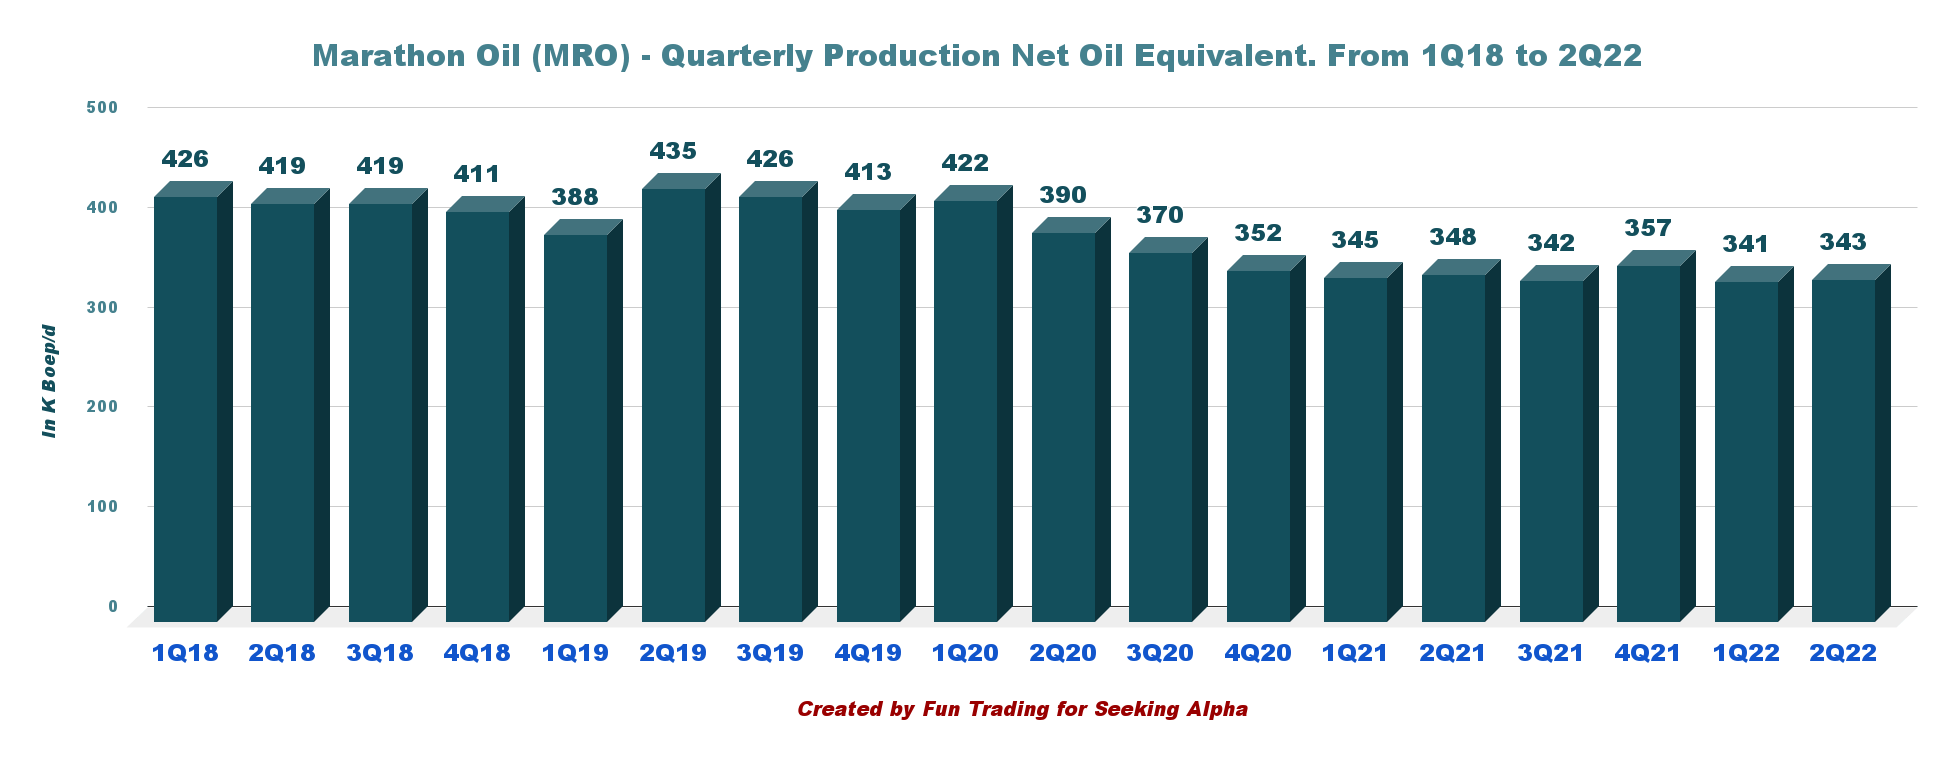
MRO Quarterly Oi equivalent production history (Fun Trading)
MRO Quarterly Oi equivalent production history (Fun Trading)
Total net production (from U.S. and International segments) in 2Q22 came in at 343K Boep/d compared to 348K Boep/d in the year-ago period.
This U.S. upstream segment reported an income of $846 million, up significantly from $207 million in the year-ago period due to higher oil and gas prices.
On the other side, the production costs were $5.80 per Boe this quarter, up 31.5% year-over-year.
Net production of 283K Boep/d this quarter, unchanged from the second quarter of 2021. Total U.S. production comprised 55.5% oil or 157K Boep/d.
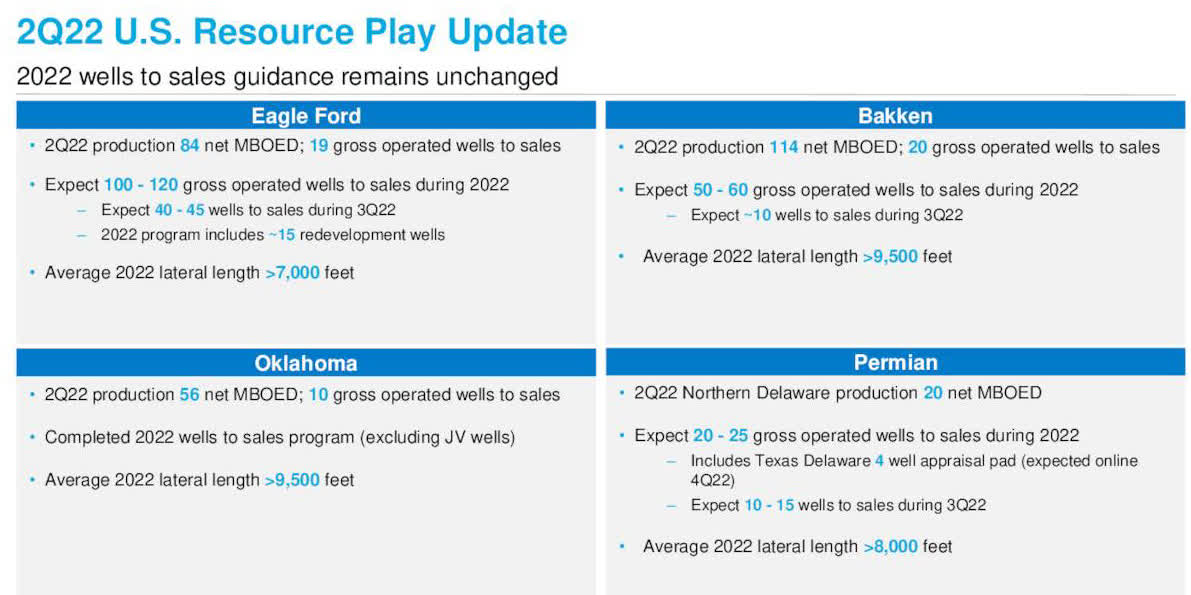
MRO US Plays update (MRO Presentation)
MRO US Plays update (MRO Presentation)
The Bakken and Oklahoma segment performed well this quarter, but the company indicated lower volumes from the Eagle Ford Basin.
Source: Excerpt from Fun Trading file.
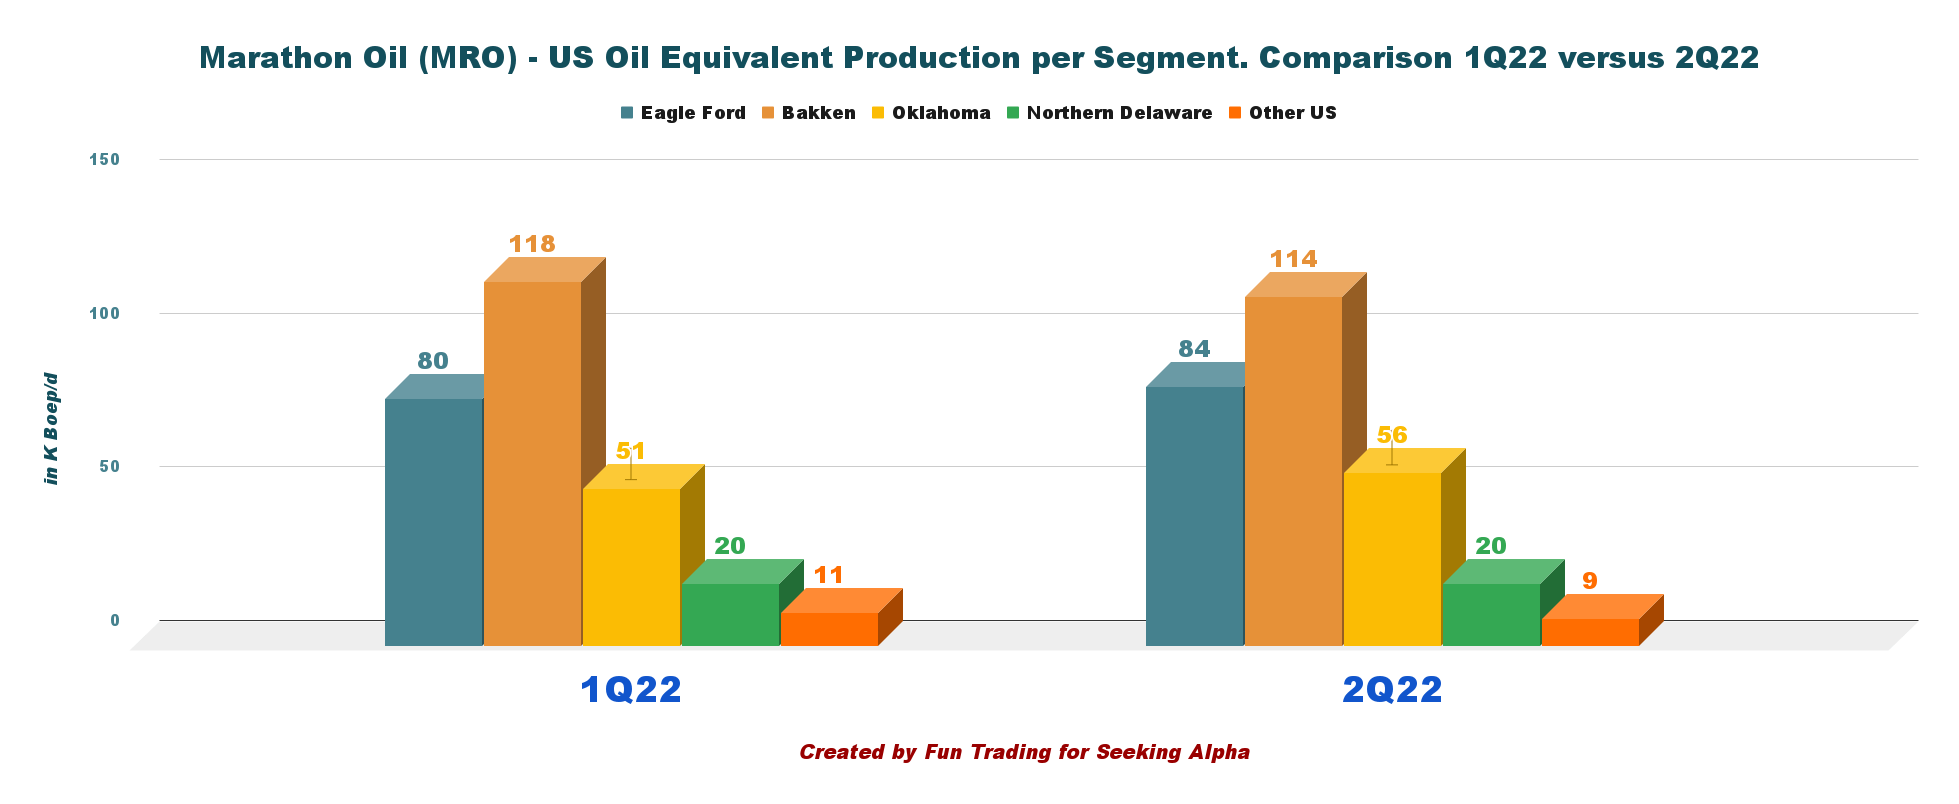
MRO Quarterly Production comparison 1Q22 versus 2Q22 (Fun Trading)
MRO Quarterly Production comparison 1Q22 versus 2Q22 (Fun Trading)
The segment reported earnings of $160 million compared with $68 million in the year-ago period due to improved liquids prices. Production was 59.7K Boepd net.

MRO EG (MRO Presentation)
MRO EG (MRO Presentation)
Marathon Oil’s average realized liquids prices (crude oil and condensate) of $110.10 per barrel were particularly above the year-earlier level of $64.73.
Natural gas liquids average price realizations rocketed 66.8% to $40.32 a barrel.
Also, average realized natural gas prices were up 31.5% yearly to $5.80 per thousand cubic feet.

MRO oil and gas prices history (Fun Trading)
MRO oil and gas prices history (Fun Trading)
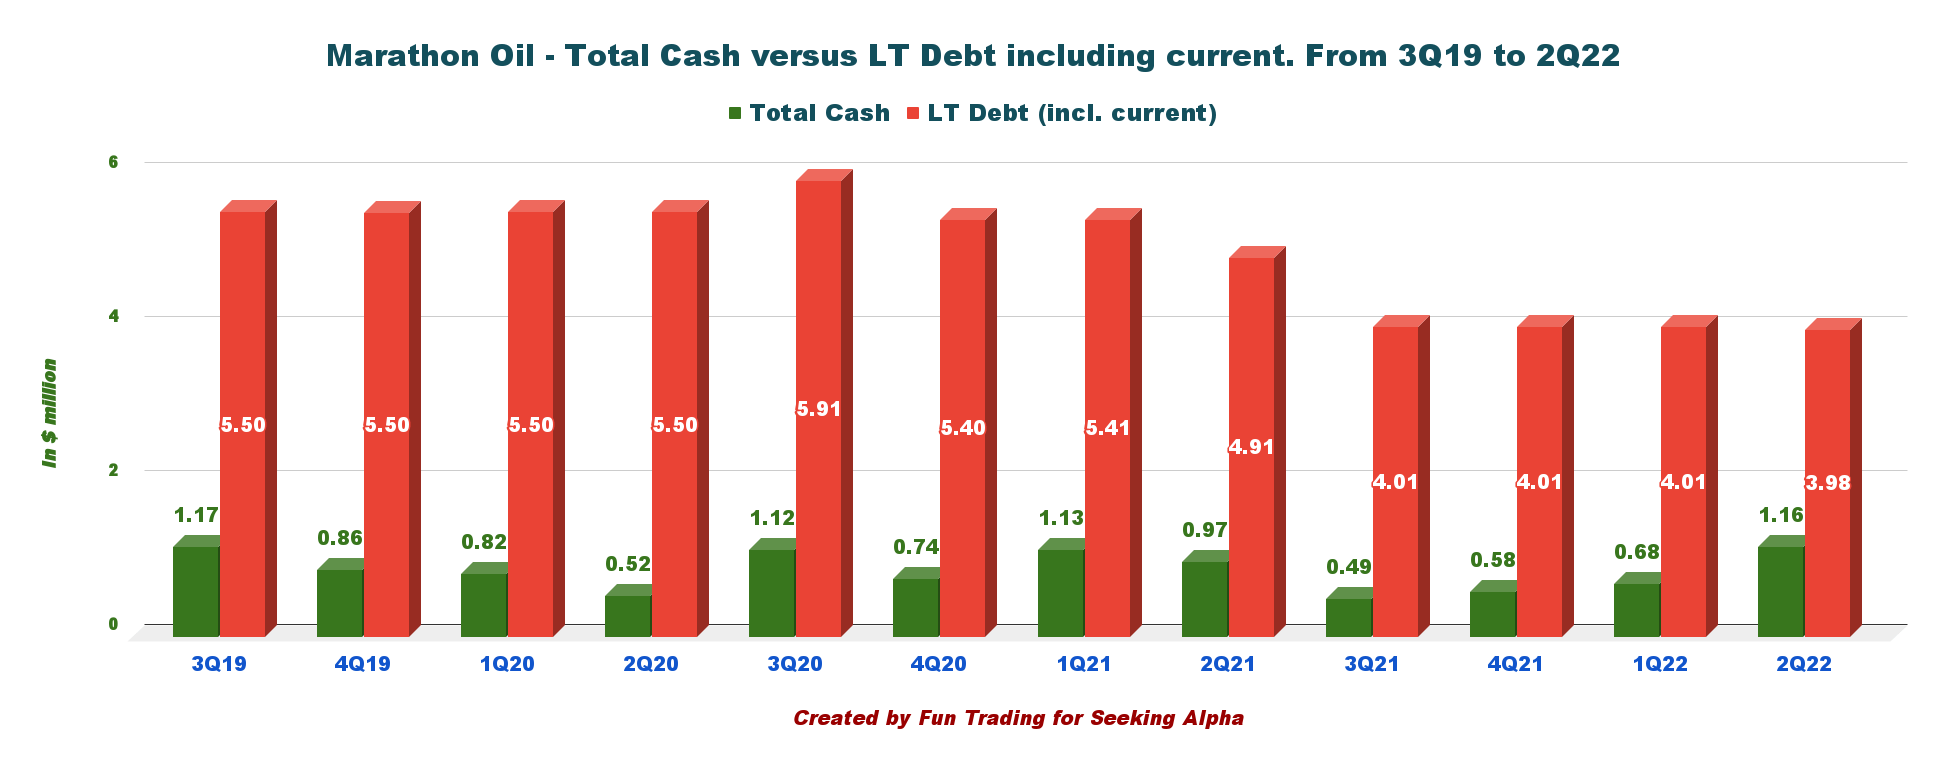
MRO Quarterly Cash versus Debt history (Fun Trading)
MRO Quarterly Cash versus Debt history (Fun Trading)
As of Jun 30, 2022, MRO had cash and cash equivalents worth $1,162 million and long-term Debt of 3.982 billion, including current. The debt-to-capitalization ratio of the company was 24.3.
Marathon has maintained the CapEx guidance at $1.3 billion for 2022.
MRO is expecting production in the range of 340K Boep/d to 350K Boep/d, unchanged from the last year.
Oil volumes in the band of 168K-176K Bop/d.
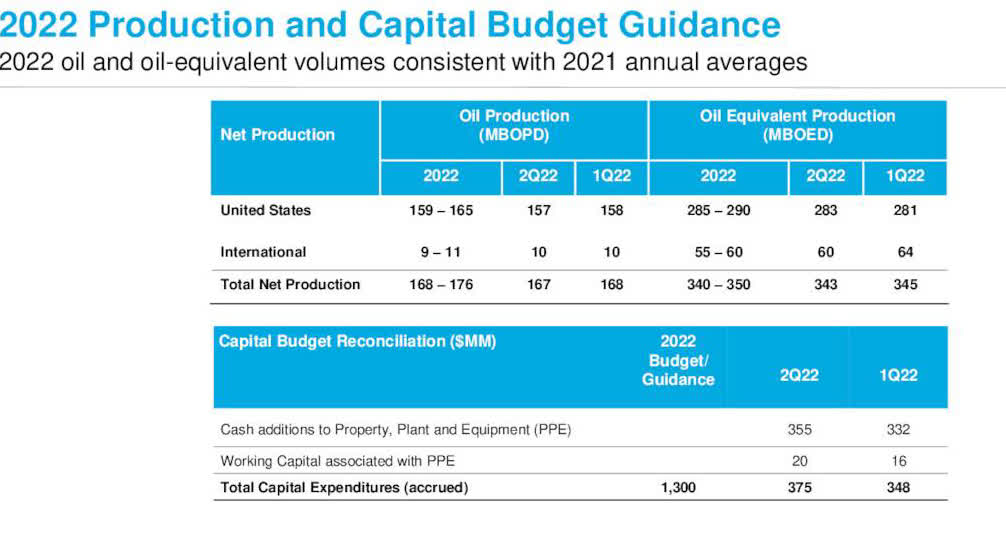
MRO Guidance 2022 (MRO Presentation)
MRO Guidance 2022 (MRO Presentation)
Assuming $60 WTI, Marathon Oil expects to return a minimum of 40% of its cash flow from operations.
Free cash flow is estimated at $4.5 billion in 2022, with $100 oil and $6 gas. However, oil prices have dropped significantly in the past few weeks, and $100 seems too high now.

MRO TA Chart short-term (Fun Trading StockCharts)
MRO TA Chart short-term (Fun Trading StockCharts)
Note: The graph is adjusted for the dividend.
MRO forms an ascending channel pattern with resistance at $27.8 and support at $23.80.
The trading strategy is to sell about 40-45% of your position between $27.5 and $28. If oil prices turn bullish, which is not likely, MRO could cross the resistance and retest $29-$31.
Conversely, if the oil prices drop lower, potentially below $85, MRO may fall below $23.80, with potential lower support at $20.50.
As I said in my preceding article, periodic wild swings characterize the oil sector, and I believe we will have plenty of that in the next 12 months. Hence, it is critical to trade a significant part of your MRO position using the LIFO strategy and keep a core long position for higher ground.
Warning: The TA chart must be updated frequently to be relevant. It is what I am doing in my stock tracker. The chart above has a possible validity of about a week. Remember, the TA chart is a tool only to help you adopt the right strategy. It is not a way to foresee the future. No one and nothing can.
Author’s note: If you find value in this article and would like to encourage such continued efforts, please click the “Like” button below as a vote of support. Thanks!

Join my “Gold and Oil Corner” today, and discuss ideas and strategies freely in my private chat room. Click here to subscribe now.
You will have access to 57+ stocks at your fingertips with my exclusive Fun Trading’s stock tracker. Do not be alone and enjoy an honest exchange with a veteran trader with more than thirty years of experience.
“It’s not only moving that creates new starting points. Sometimes all it takes is a subtle shift in perspective,” Kristin Armstrong.
Fun Trading has been writing since 2014, and you will have total access to his 1,988 articles and counting.
This article was written by
I am a former test & measurement doctor engineer (geodetic metrology). I was interested in quantum metrology for a while.
I live mostly in Sweden with my loving wife.
I have also managed an old and broad private family Portfolio successfully — now officially retired but still active — and trade personally a medium-size portfolio for over 40 years.
“Logic will get you from A to B. Imagination will take you everywhere.” Einstein.
Note: I am not a financial advisor. All articles are my honest opinion. It is your responsibility to conduct your own due diligence before investing or trading.
Disclosure: I/we have no stock, option or similar derivative position in any of the companies mentioned, and no plans to initiate any such positions within the next 72 hours. I wrote this article myself, and it expresses my own opinions. I am not receiving compensation for it (other than from Seeking Alpha). I have no business relationship with any company whose stock is mentioned in this article.