David Becker/Getty Images Entertainment
David Becker/Getty Images Entertainment
Skechers U.S.A., Inc. (NYSE:SKX) is the underdog of the footwear industry that has enough infrastructure, branding power, and a direct to consumer strategy to scale up internationally in the next phase of their development. The business has been largely flying under the public radar and is currently positioned in a discounted market before the results of the expansion become apparent.
We attempted to value Skechers and estimated an intrinsic value of $7.15b, or $47 per share, with a 1-year price target of $51, representing some 40% upside.
The company is positioned in a growing industry and primed to both grow alongside competitors as well as expand its market share by becoming more present in digital channels and partly displacing white label competitors. The risk factors for the investment are generally low, and can be addressed by a traditional focus on the bottom line and shareholder’s returns.
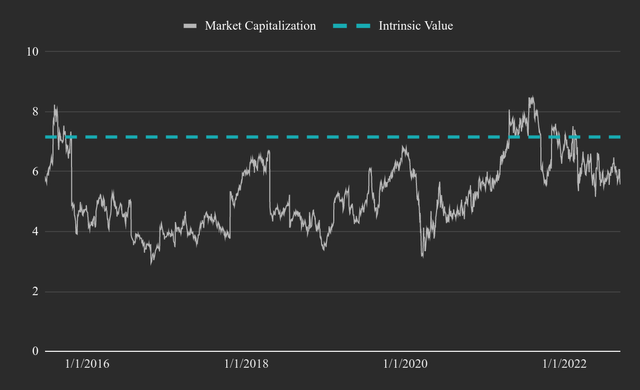
Skechers Estimated Intrinsic Value (Author Image Created With Data From FMP)
Skechers Estimated Intrinsic Value (Author Image Created With Data From FMP)
For a summary of the results, you can skip to the Valuation section in the bottom. You can also copy/view the full excel model used in this valuation here. Or access a view-only version here.
Skechers is an international company that designs and markets footwear under the Skechers Lifestyle, Performance, Work, and Kids lines. Aside from footwear, Skechers also markets an apparel line.
The production is predominantly outsourced to China and Vietnam, where some key producers own minority interest in Skechers.
The company now has two key segments: Wholesale (WS) and Direct-to-Consumer (DTC). Wholesale includes the distribution to their partner network of stores, franchisees (approx. 2950 branded stores), e-commerce retailers and international distributors.
DTC represents their company-owned store and online distribution. Skechers has around 1360 stores. Growth from this segment is mostly expected to come from improving their online presence.
In total, their physical locations add up to about 4355 stores. Breaking down by type, we get: domestic 526, international 836, partner 2993.
In FY 2021, the company had sales of $2.55b in the U.S. and $3.7b internationally, which makes up some 60% of the revenue, covering about 170 countries. The customer base seems well diversified, with the top five wholesale customers not making up more than 8.6% in 2021.
In the Q2 earnings press release, we see that the company made a record of $1.87b in sales. This indicates resilience, as the company was faced with macroeconomic, supply chain and lockdown headwinds.
WS grew $176.1m, or 18.3%, was led by increases in AMER of 34.9%. WS volume increased 14.8% and average selling price increased 3.1%. DTC sales grew $29.8m, or 4.3%, led by increases in EMEA with 13.5%, mostly attributable to price increases. Some 39% of sales or $727.5m came from DTC, and the company views this segment as underdeveloped with the most long-term growth potential.
Quarterly gross margin was 48.1%, a decrease of 3.3% YoY, primarily driven by higher per unit freight costs partially offset by average selling price increases.
In order to get a better picture of the current performance, we can view the Trailing Twelve Month (TTM) fundamental table below:
The company has record cash tied up in inventory, valued at $1.56b, while accounts payable and receivables are marking steady growth. The working capital of the company is $1.56b, down by $157m QoQ – This is good because it indicates that some of the supply chain pressures are lifting, and the company can normalize cash conversion from their working capital. Given the high inventory levels, we may see a marking down of products that will impact profitability in the next few quarters.
Management indicates that they are seeing a loosening of freight prices (30:15), which may initiate relief for supply chain pressures. Freight costs were impactful in the gross margin and investors may react positively if this starts recovering.
For Q3 2022, the Company believes it will achieve sales between $1.80b and $1.85b, and diluted EPS between $0.70 and $0.75.
FY 2022 outlook is set between $7.2b and $7.4b for sales, and between $2.60 to $2.70 for diluted EPS. With domestic growth expectations ranging from the mid to high single digits, while the fastest growing market being outside of the U.S.
Management has a $10b sales target by 2026 (end of FY 2025), which necessitates a revenue growth of 6% for 2022/2023, and at least 17% in the next 2 years. This may be too strong, and we will elaborate why in the valuation section.
The company has initiated a share repurchase program to further incentivize investors. This may be used to lower the cost of capital ((financial risk)) for the company if it helps elevate the stock to its intrinsic value. According to the set allowance, the company can repurchase a remaining $450.8m worth of shares as of Q2 2022. This is equal to 2.2% per annum of the current market value. The program is authorized up until EOY 2025.
The company is currently at a stage where it is prioritizing internal investments and growth from expansion. This means that it is less focused on acquisitions which signals that they have enough growth avenues that can be funded. Part of the mentioned growth projects include revamping the tech stack, improving the online presence, DTC growth, establishing channels for better customer relationships.
The company is progressing on the digital branch, however, it seems to be still lagging in some areas, especially in the front-end of their online stores. A web audit for the online store performance revealed that the company has room to improve the quality of its web infrastructure, while the design of some of the online stores looks like it hasn’t been a priority for a long time.
Audit results for a few sites ((0 to 100)):
Consumers now have higher expectations from online stores, and the company may want to attempt to come close to par with the design and UX level of peers such as Otrium and Zalando. While management may argue that consumers mostly shop from 3rd party online stores, the front-end of the modern web presence helps justify the product pricing and increases control in brand messaging.
We scanned the annual reports of the company going back to 2017, and found no signs of any Enterprise Resource Planning (ERP) systems in place or plans for integrating such infrastructure. While it is likely that the company has some internal system for managing resources on a large scale, best practices for international businesses indicate that a plausible cost-cutting project would be to have a streamlined ERP system that would reduce operating expenses, help the company scale internationally, and better manage working capital by using forecasting analytics.
While DTC is estimated to play a larger role in the future, as it provides a more convenient way to bring products to customers, the company will still rely on its physical presence. We may see a flip of the proportions from DTC to WS, with the former becoming a larger portion of sales, and the established physical networks may support the brand development as people will have the opportunity to try the products and build trust with the brand over time – allowing them to recognize and more easily adopt the brand from online stores.
Pushing on the DTC front will take some time since the company needs to improve the mentioned front-end, user experience, build a customer relationship system where it can successfully send qualified offers and manage loyalty. With that said, this is also an avenue where the company can unlock value.
In the last 2 quarters, the company invested some $163.5m CapEx for expanding offices domestically and in India ($50.7m), investments in distribution infrastructure ($49.9m), and investments in retail stores & DTC technologies ($49.1m).
The company expects CapEx to be between $100m and $150m for the remainder of 2022, roughly focused on the same objectives as before. Management has engaged in increased Net CapEx ((CapEx – Depreciation)) spending as it has grown over the years, with Net CapEx growing from $53.4m in 2017 to $182m in the last three months. Capital investments are the foundation of growth, and a key factor of what makes the company’s growth story viable for investors. A mix of debt and equity financing for these investments allows the company to manage taxes and allocate some funds for investor returns.
The company has more than 7m square feet in directly and indirectly operated international distribution centers ((warehouses)), including:
The company has undertaken debt financing to ensure the construction and upgrade of some of their distribution centers, and prepare a second distribution center in China. The infrastructure is meant to support the Chinese market, as the company is hoping to see Chinese consumer demand reemerge after lifting the lockdowns.
The company is focused on expanding its presence internationally. In that regard, we can expect increased focus on the Indian and South American markets. In a recent investor presentation for Goldman Sachs, the CFO noted that these two markets are of strategic importance. India mostly because of the population level, but also because Nike is not as present in that market. South America is also a priority, which seems like a good direction as the demographic characteristics fit the product, and Chile seems to exhibit an organic demand for the brand. Aside from Chile, the company has distribution partners in Peru and Columbia.
While not the most reliable indicator, data provided by Google trends is a plausible way to assess the regions with brand recognition and demand. From the map below, we can see that in the last 5 years Skechers has been searched for internationally, with the most search queries coming from: Chile, Turkey, Ireland, Denmark, and the U.K.
Note that China is not present in Google search, so we cannot derive data from there.
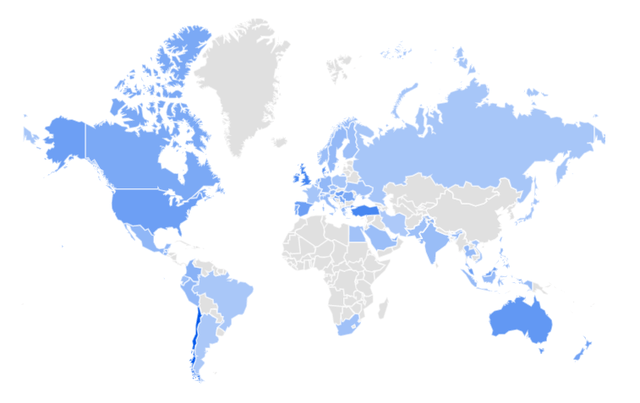
Skechers Online Search Interest by Region (Google Trends)
Skechers Online Search Interest by Region (Google Trends)
Looking at the timeline of interest, we see that worldwide interest for the product (measured by topic search trends) seems to be above the 75 percentile in the last five years, indicating that the brand may be gaining some increased popularity among customers.

Skechers (topic) Worldwide Google Search Interest Over The Last 5 Years (Google Trends)
Skechers (topic) Worldwide Google Search Interest Over The Last 5 Years (Google Trends)
This is likely a mixed result from the investments in brand recognition and establishing customer loyalty by providing a fitting product.
According to Statista, in 2020 the global footwear market was estimated to be worth $365.5b, and is forecast to reach $530.3b by 2027. Implying a CAGR of 5.46%. A second source, Grandviewresearch, values the 2022 footwear market at $387.74b, with an estimated growth to $543.9b in 2030. This estimate implies a CAGR of 4.3%.
If the estimates are reliable and the company grows in-line with the industry expansion, a CARG of 4.3% to 5.5% should be the baseline of revenue growth, anything above this can be attributed as a gain in market share.
Here we will re-cap and compare the key competitors of Skechers. The goal is to provide a relative benchmark for our valuation.
Management has stated that their goal is to cement their place as the 3rd largest footwear provider in the world. With $6.9b in revenue, Skechers seems to have about 1.8% of the industry market share. On a sales basis, the company seems to be behind Nike (NKE), Adidas (OTCQX:ADDYY) and Puma (OTCPK:PMMAF). It is also trailing these companies on a market cap basis. For investors, this may not be so bad as it leaves the company away from the media spotlight. Here is the selection of international competitors that we will compare Skechers against:
Not included but worth inspecting: Dr. Martens (OTCPK:DOCMF) (OTCPK:DRMTY), CCC ((Warsaw Stock Exc.)).
The total revenue value from the 6 listed competitors adds up to $88b representing some 23% of the estimated global footwear market, indicating that there is a lot of market share uncaptured by the top companies, leaving significant room for expansion.
Aggregating the peer data reveals that historically, this group of peers has exhibited 7.8% revenue growth, and a median EBIT margin of 9.5%. The margins ranged from a median of 7.6% to 12.5% in the last 4 years.
Looking at two market ratios, we find that the median EV/Sales is 1.9x, and the historical EV/EBIT is 21.8x. This can give us only a historical reference point when assessing where the peers fall on their relative values. In the table below, we will break down these metrics for each company:
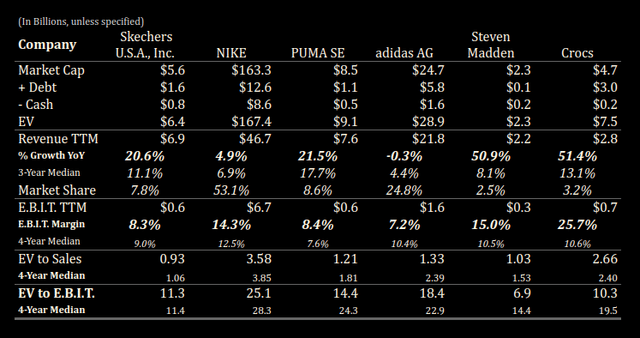
Skechers Peer Comparison (Author Image Created With Data From FMP)
Skechers Peer Comparison (Author Image Created With Data From FMP)
We can see that most of the companies listed seem to be trading at fair value based on their historical performance. Even though it looks as if there are outliers, like Nike and Crocs, keep in mind that the EV to EBIT values are quite reasonable for the portion of profit they are producing.
On the other side of the spectrum, we may discover some undervalued opportunities on both ratio metrics. These are Skechers, and Steven Madden. It seems that the companies have grown above their average rates, however the market is reacting slowly to the fundamentals of the companies, and the price seems to follow a general trend rather than the intrinsic value.
The fundamentals are the last step we will look at before the final valuation model. In this section, we will analyze the company’s past performance and use our segments to establish the key value drivers for the future of the company.
We believe that management’s implied growth rate (in the outlook section) is too strong, and are modeling 7% growth for 2023 and 9% for the 4 years thereafter, with a decay function converging to the market implied long term growth rate of 3.5% in year 10.
For the 4 years after the next 12 months, we believe that the company will experience organic growth from their DTC strategy and are confident in opting for the 9% rate. From the chart below, we find the 5-year revenue CAGR to be 12.6%, vs the industry 5-year average growth of 6.1%.
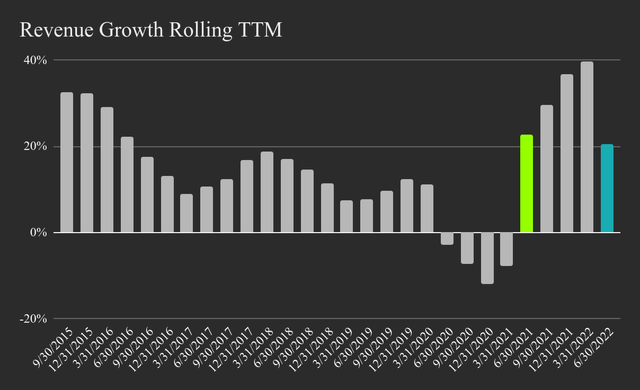
Skechers Historical Rolling TTM Revenue Growth (Author Image Created With Data From FMP)
Skechers Historical Rolling TTM Revenue Growth (Author Image Created With Data From FMP)
While the company has seen a rebound in growth from 2021, the trend is more likely to revert to pre-pandemic levels and start leveling off towards industry averages.
In the last 12-months, the TTM gross margin decreased to 47.8% as the company absorbs pressures from increased international freight costs. However, the growing DTC segment has the potential to boost the margin upwards, as it currently marks a quarterly 66.1% gross margin. In our estimates, DTC has much more growth potential and will grow faster than the wholesale segment.
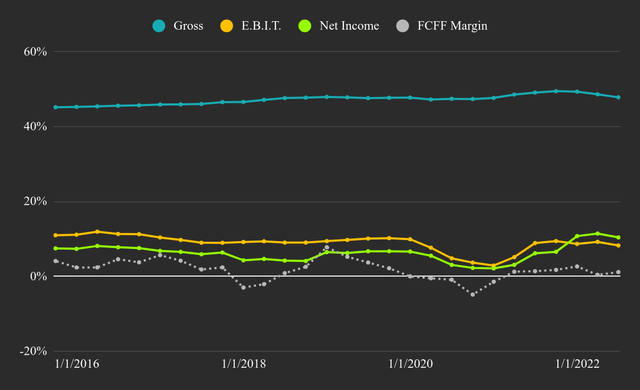
Skechers Historical TTM Profitability Margins (Author Image Created With Data From FMP)
Skechers Historical TTM Profitability Margins (Author Image Created With Data From FMP)
Management is targeting the low-teens in operating margins (13-14%). This has historically not been the case, and most peers have a hard time staying above 10.5%. Further, the company’s approach of: “Style, Comfort, and Quality At a Reasonable Price”, is in conflict with a higher profit margin.
Given the growth potential, market positioning and competitor averages, we wouldn’t go too far above 11.5% at the end of the forecast period. However, this allows for a growing market-share and customer loyalty which may turn out to be a successful combination.
Looking at the cash flow trends on a rolling TTM basis, gives us some clues why the market may be reserved on Skechers. Cash from operations is suffering and investors may want to wait out for a stabilization in performance before coming back to the company.
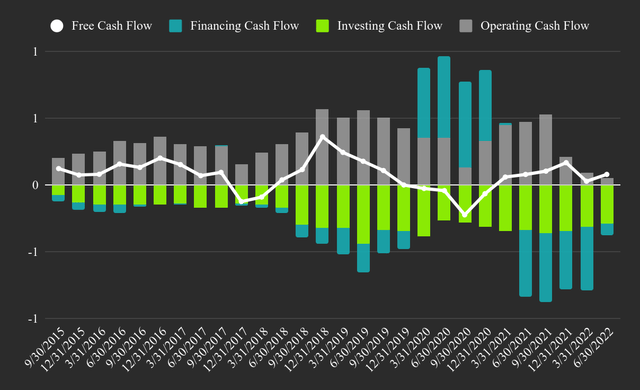
Skechers TTM Cash Flows (Author Image Created With Data From FMP)
Skechers TTM Cash Flows (Author Image Created With Data From FMP)
The decrease of the gross margin has likely led to a reduction of operating cash flows, which is why we see the decrease in 2022. Since 2016, the company has averaged about 75m in free cash flows, but given the growth considerations, we estimate that free cash flows will pick up after 2026, which can impact the value of Skechers. The company is also continuously investing in the business, and we expect annual CapEx to range between $300m and $550m in the following years.
Given our analysis, we have constructed the following future model for Skechers. At the end of the model, we estimate revenue of $13.7b, growing at a sustainable rate of 3.5%. This places the company at 2.4% market share at the end of the forecast period in 2032, which is an improvement on the est. 1.8% share they currently hold.
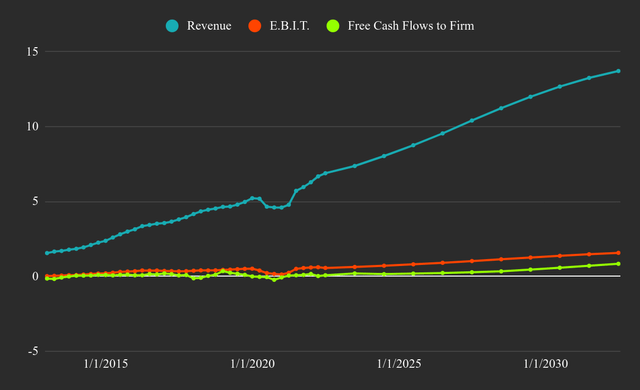
Skechers Historical Fundamentals and 10-Year Intrinsic Value Model (Author Image Created With Data From FMP)
Skechers Historical Fundamentals and 10-Year Intrinsic Value Model (Author Image Created With Data From FMP)
We expect EBIT margins to converge to 11.5%, which would reflect $1.6b in annual EBIT, representing a tripling of EBIT in the next 10 years.
In order to achieve this, the company needs to reinvest a total of $4.8b at a 1.6 sales to capital efficacy rate. Which means that CapEx would need to increase $100m to $200m in the next few years.
Free cash flows to the firm are expected to start significantly improving after 2027 when the company has settled in the new target markets and improved its DTC processes. The sum of future free cash flows is estimated to be $4b, with a present value of $2.2b.
As Sketchers is an international company, it is subject to these markets and risk metrics. We employ a traditional DCF approach in estimating the discount rate by using the best estimate of the cost of capital, derived by a bottom up beta. Using this approach, we estimate a starting discount rate of 9%, which converges to 8.6% at maturity. This sets the company’s terminal value to 13.9b, which is valued to $5.9b at present.
Summing up the present values of the free cash flows to the firm, terminal value and applying adjustments for debt and cash, gives us an intrinsic value of $7.15b, implying that Skechers may be undervalued by 22%. This represents a value per share of $47, and a one year price target of $51, with a 40% upside.
The fundamental investment horizon based on the standard deviation of the stock of 50% is estimated at 10 months. At maturity (2032 onward), the company is estimated to be worth $13.9b, or $84 per share, representing a 130% upside for long-term investors. The minimum investment horizon for long-term investors is 31 months.
The production line is mostly reliant on China, which may present a categorical risk factor should trade relations worsen. We are aware that this seems highly unlikely, but the risk is there, even if it stays dormant. We also appreciate that the company has been attempting to diversify its production chain, but is far from embarking on a campaign to onshore production.
The biggest opportunity is likely nothing innovative, but rather found in the steady business growth driven by providing customers with fitting products while improving the online presence. The company is not embarking on large innovative campaigns or acquisition spurs, which is actually quite good as it allocates resources and attention where they are the most productive. The establishment of international infrastructure and investment in the Indian market may prove to be great investments, however India is known for painful legal compliance, so streamlining that business may take some time, and an effective ERP system may help with international expansion. Note, it is likely that the company has some system, however, they may want to communicate it better to investors.
The company also has the “last mover” advantage (as opposed to first mover) in implementing its DTC strategy for the simple reason that it can easily discover best practices and learn from the mistakes that were made by innovators in this field.
The company has little history with litigation, but the last case gives hints on how the company is run and who has the control. Further, it gives the appearance of an interconnected board.
On July 21, 2022 a shareholder initiated a lawsuit for allegedly breaching fiduciary duties. Upon digging a bit deeper, we learn that the central focus of the lawsuit is the alleged misuse of the two company jets for personal purposes by top board members, including the CEO, President, COO and their friends.
While we may not see a successful activist intervention, it is likely that investors are aware of the current leadership style and a possible catalyst may be a change in top leadership.
The company settled three claims on design infringement alleged by Nike on November 30, 2021. It is reasonable to assume that these kinds of litigation will persist in the future, however the company seems to have the necessary resources to defend its brand presence.
The company’s common stock is mostly owned by institutions, which may be also invested in the company’s competitors. If this is the case, then institutional investors will have little interest in the company’s success. For example, FMR LLC owns 13% of the company, but also has 12.6% ownership in Crocs and has a 1.11% stake in Nike. It would seem that some investors may be bullish on the industry, but not necessarily on a particular company.
The public has a very low 3% ownership stake in Skechers, which may indicate that it can take a longer time for investors to react to catalysts, and for the price to converge to value.
We estimate that Skechers is undervalued by some 22%. The company may also grow its price per share after it matures and shifts to more frequently returning capital for investors.
It seems that Skechers has a growing brand and an expanding infrastructure, allowing it to scale up internationally with an emphasis on India and South America. This process will last at least five years, and they will have to execute both on expansion and profitability. After this, the company may focus on returning capital to investors or perhaps leveraging the brand and infrastructure to move to other product verticals.
Investors that believe in the successful execution of the growth story will find themselves ahead of the curve on this investment, and have an opportunity to enter in a market where equity prices are discounted.
The investment horizon for this company is a minimum of 10 months for a chance for the company to converge to value, and a minimum of 30 months for investors to price the company on the basis of its mature growth capacity.
We view the constraints of the current leadership as temporary issues, and the lack of the software infrastructure as potential value opportunities. Subjectively, the key categorical risk factor for Skechers are the non-diversified production capacities in Asia. In the event of a disruption in Asia, investors need to ask themselves “if the company can produce elsewhere, and if it can stay profitable in doing so?” This illustrates the symbiotic relationship between a company and its investors – as having an $80 price per share would make the conversation for onshoring production much easier at the bargaining table against creditors. Companies don’t need investors in good times.
In conclusion, Skechers is an undervalued company positioned to scale up in a growing industry. The expansion and DTC projects are now setting the foundation for a possible tripling of EBIT at maturity.
This article was written by
Disclosure: I/we have no stock, option or similar derivative position in any of the companies mentioned, and no plans to initiate any such positions within the next 72 hours. I wrote this article myself, and it expresses my own opinions. I am not receiving compensation for it (other than from Seeking Alpha). I have no business relationship with any company whose stock is mentioned in this article.
